The number of 'Poor to Severe Air Quality' days down from 108 in 2016 and 68 in 2023
GN Bureau | May 1, 2023
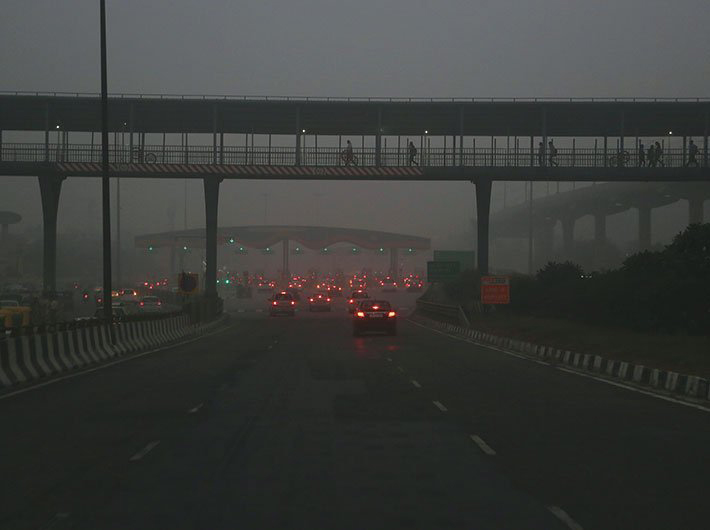
Delhi has witnessed a maximum number of days with ‘Good to Moderate’ Air Quality during the first four months of 2023, compared to the corresponding period of last seven years (barring the periods of very low anthropogenic, industrial and commercial activities during the Covid-19 lockdown year 2020), according to the Air Quality Index (AQI) data of the Central Pollution Control Board (CPCB).
A comparative chart for days with ‘Good to Moderate’ AQI witnessed for the first four months’ period during the eight years (2016-23) is depicted below:
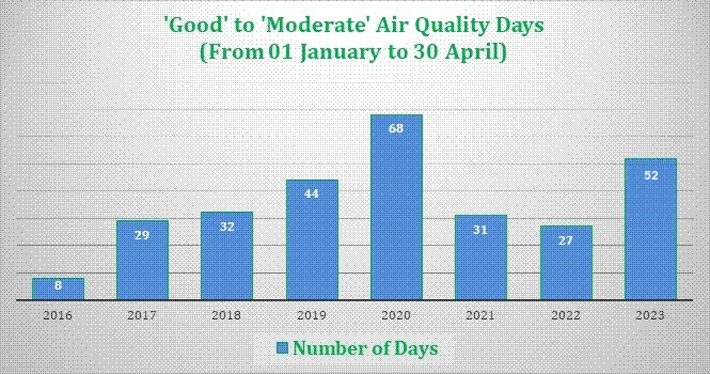
The number of ‘Good to Moderate’ Air Quality days for January-April period were 8 in 2016; 29 in 2017; 32 in 2018; 44 in 2019; 68 in 2020; 31 in 2021; 27 in 2022; and 52 this year, according to an official release issued Sunday.
During this period, Delhi has also experienced the least number of days with ‘Poor to Severe’ Air Quality in 2023, as compared to the corresponding period of last 07 years since 2016 (except 2020 – the year of the lockdown).
The number of ‘Poor to Severe’ Air Quality Days for the first four months have come down from 108 in 2016 to 68 in the current year, which is a 37.03% drop.
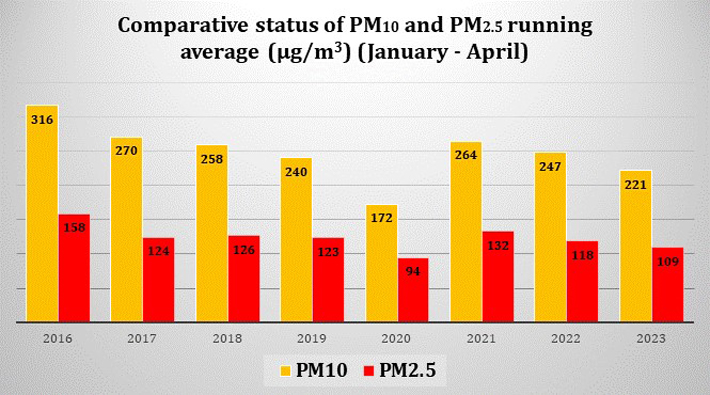
In terms of daily average, PM2.5 concentration levels in Delhi, 2023 has been the year with lowest levels of daily average PM2.5 concentration, as compared to the corresponding period for last seven years, i.e., from 2016 (barring 2020). Moreover, 2023 has also been the year with lowest levels of daily average PM10 concentration in Delhi, as compared to the corresponding period for last seven years.
A comparative chart depicting the PM10 and PM2.5 running average (µg/m3) for the January-April period during the eight years (2016-23) is given below:
Delhi has also reported its lowest Average AQI in 2023 as compared to the corresponding period for last 07 years i.e. from 2016 (barring 2020). A comparative chart depicting the Average AQI for the first four months’ period (January to April) during the eight years is given below:
Persistent field-level efforts and targeted policy initiatives in the short/ medium/ long term are expected to result in gradual but marked improvement in the air quality.
Last summer, the two of us spent several weeks in rural Madhya Pradesh with a non-profit that works on gender justice through women’s self-help groups. We went in with a notebook full of laws. The Protection of Women from Domestic Violence Act. The Dowry Prohibition Act. Free legal aid for every wo
Digital payments have become a reflex for urban India, but the confidence earned in paying has not yet carried over to borrowing. That is the central finding of `How Urban India Pays Report 2026`, released by Pahlé India Foundation in collaboration with Amazon Pay. Based on a survey of 5,149 consu
Commerce and industry minister Piyush Goyal has called upon businesses in India and the United Kingdom to translate the opportunities created by the India-UK Comprehensive Economic and Trade Agreement (CETA) into expanded trade, investment, partnerships and job creation. Addressing the Bu
The Gandhian movement in India, after Gandhi’s death, failed, says Ramachandra Guha, and blames Vinoba Bhave for it. But the movement found new, fertile grounds around the world and succeeded in bringing about a change in South Africa, the US and elsewhere. It is high time it returned home. Of cour
Tavleen Singh, noted journalist and political commentator, has turned to fiction, with her debut novel ‘The Actor’ (HaperCollins India). Set in the near future, it has a superstar, Amit Singh, turning to politics, when the political landscape is dominated by prime minister Guru Gaynendraj
The union cabinet, chaired by prime minister Narendra Modi, on Tuesday approved the setting up of a Special Purpose Vehicle (SPV), called Integrated Transport & Logistics Authority (ITLA), to strengthen research, planning, appraisal, monitoring and impact assessment within the broad domains of Transp