Overall Trade Deficit during April-Oct down by 35.86%; Merchandise Trade deficit also improves
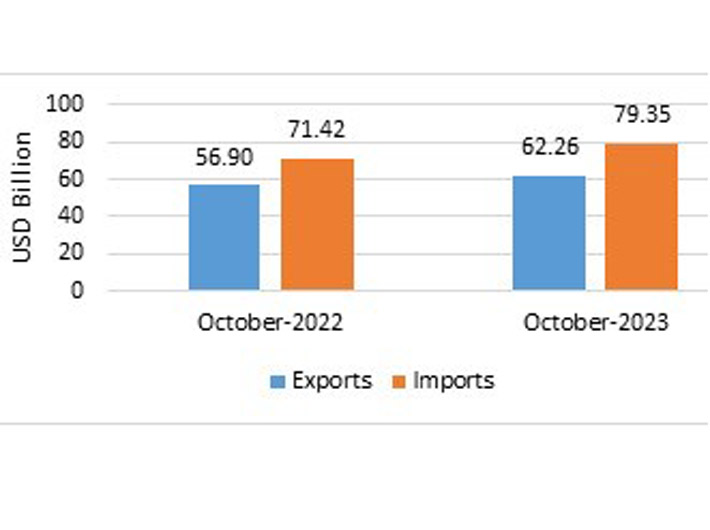
India’s overall exports (Merchandise and Services combined) in October 2023 (by quick estimates) is estimated to be $62.26 billion, exhibiting a positive growth of 9.43% over October 2022. Overall imports in October 2023 is estimated to be $79.35 billion, exhibiting a positive growth of 11.10% over October 2022.
India’s overall exports (Merchandise and Services combined) in April-October 2023 are estimated to be USD 437.54 Billion, exhibiting a negative growth of (-) 1.61 per cent over April-October 2022. Overall imports in April-October 2023* are estimated to be USD 495.17 Billion, exhibiting a negative growth of (-) 7.37 per cent over April-October 2022, an official release said on Wednesday.
For Quick Estimates, click here: https://static.pib.gov.in/WriteReadData/specificdocs/documents/2023/nov/doc20231115270501.pdf
MERCHANDISE TRADE
Merchandise exports in October 2023 were USD 33.57 Billion, as compared to USD 31.60 Billion in October 2022.
Merchandise imports in October 2023 were USD 65.03 Billion, as compared to USD 57.91 Billion in October 2022.
Merchandise exports for the period April-October 2023 were USD 244.89 Billion as against USD 263.33 Billion during April-October 2022.
Merchandise imports for the period April-October 2023 were USD 391.96 Billion as against USD 430.47 Billion during April-October 2022.
The merchandise trade deficit for April-October 2023 was estimated at USD 147.07 Billion as against USD 167.14 Billion during April-October 2022.
Non-petroleum and non-gems & jewellery exports in October 2023 were USD 24.57 Billion, compared to USD 21.99 Billion in October 2022.
Non-petroleum, non-gems & jewellery (gold, silver & precious metals) imports in October 2023 were USD 36.87 Billion, compared to USD 35.12 Billion in October 2022.
Non-petroleum and non-gems & jewellery exports during April-October 2023 was USD 178.42 Billion, as compared to USD 182.24 Billion in April-October 2022.
Non-petroleum, non-gems & jewellery (gold, silver & precious metals) imports were USD 246.50 Billion in April-October 2023 as compared to USD 260.01 Billion in April-October 2022.
SERVICES TRADE
The estimated value of services export for October 2023 is USD 28.70 Billion, as compared to USD 25.30 Billion in October 2022.
The estimated value of services import for October 2023 is USD 14.32 Billion as compared to USD 13.51 Billion in October 2022.
The estimated value of services export for April-October 2023 is USD 192.65 Billion as compared to USD 181.37 Billion in April-October 2022.
The estimated value of services imports for April-October 2023 is USD 103.22 Billion as compared to USD 104.09 Billion in April-October 2022.
The services trade surplus for April-October 2023 is estimated at USD 89.43 Billion as against USD 77.28 Billion in April-October 2022.
For the month of October 2023, under merchandise exports, 22 of the 30 key sectors exhibited positive growth in October 2023 as compared to same period last year (October 2022). These include Iron Ore (2595.91%), Ceramic Products & Glassware (48.16%), Tobacco (47.6%), Cereal Preparations & Miscellaneous Processed Items (40.95%), Meat, Dairy & Poultry Products (38.57%), Cotton Yarn/Fabs./Made-Ups, Handloom Products Etc. (36.49%), Oil Seeds (29.7%), Drugs & Pharmaceuticals (29.31%), Electronic Goods (28.23%), Fruits & Vegetables (24.48%), Oil Meals (17.32%), Carpet (16.63%), Plastic & Linoleum (12.83%), Spices (10.78%), Man-Made Yarn/Fabs./Made-Ups Etc. (10.23%), Coffee (8.45%), Marine Products (8.16%), Engineering Goods (7.2%), Handicrafts Excl. Hand Made Carpet (4.72%), Tea (4.12%), Cashew (3.29%) and Jute Mfg. Including Floor Covering (0.42%).
Under merchandise imports, 10 out of 30 key sectors exhibited negative growth in October 2023. These include Cotton Raw & Waste (-78.69%), Vegetable Oil (-35.7%), Fertilisers, Crude & Manufactured (-34.58%), Transport Equipment (-33.99%), Pulp and Waste Paper (-33.38%), Newsprint (-33.08%), Project Goods (-23.73%), Pearls, Precious & Semi-Precious Stones (-9.76%), Wood & Wood Products (-7.82%) and Leather & Leather Products (-5.38%).
For April-October 2023, under merchandise exports, 14 of the 30 key sectors exhibited positive growth during April-October 2023 as compared to April-October 2022. These include Iron Ore (157.03%), Oil Meals (37.71%), Electronic Goods (27.7%), Oil Seeds (24.39%), Ceramic Products & Glassware (23.65%), Tobacco (12.99%), Fruits & Vegetables (12.82%), Drugs & Pharmaceuticals (8.14%), Cereal Preparations & Miscellaneous Processed Items (6.32%), Cotton Yarn/Fabs./Made-Ups, Handloom Products Etc. (5.65%), Meat, Dairy & Poultry Products (4.54%), Coffee (4.02%), Spices (2.35%) and Cashew (0.72%). During April-October 2023 electronic goods exports were recorded at USD 15.48 Billion as compared to USD 12.13 Billion during April-October 2022, registering a growth of 27.70 percent.
Under merchandise imports, 17 of the 30 key sectors exhibited negative growth in April-October 2023 as compared to April-October 2022. These include Cotton Raw & Waste (-65.07%), Silver (-62.55%), Sulphur & Unroasted Iron Pyrites (-40.4%), Fertilisers, Crude & Manufactured (-35.92%), Coal, Coke & Briquettes, Etc. (-32.83%), Vegetable Oil (-24.87%), Pearls, Precious & Semi-Precious Stones (-24.02%), Organic & Inorganic Chemicals (-22.08%), Petroleum, Crude & Products (-18.72%), Textile Yarn Fabric, Made-Up Articles (-16.61%), Leather & Leather Products (-13.95%), Transport Equipment (-13.06%), Wood & Wood Products (-12.3%), Newsprint (-8.31%), Pulp And Waste Paper (-5.81%), Metaliferrous Ores & Other Minerals (-4.49%) and Artificial Resins, Plastic Materials, Etc. (-4.4%).
Services exports is projected to grow positively at 6.22 percent during April-October 2023 over April-October 2022.
India’s trade deficit has shown considerable decline in April-October 2023. Overall trade deficit for April-October 2023 is estimated at USD 57.64 Billion as compared to the deficit of USD 89.86 Billion during April-October 2022, registering a decline of (-) 35.86 percent. The merchandise trade deficit during April-October 2023 is USD 147.07 Billion compared to USD 167.14 Billion during April-October 2022, registering a decline of (-) 12.01 percent.